
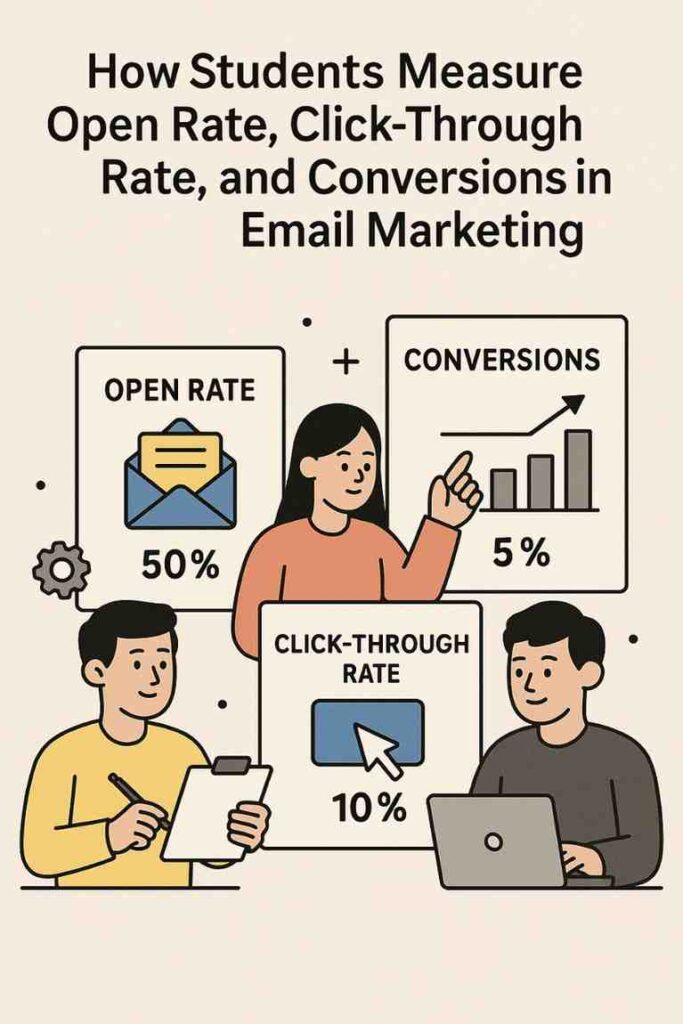
In the realm of digital marketing, particularly email marketing, understanding key performance metrics is essential for evaluating campaign success and optimizing future efforts. For students learning email marketing—whether in academic settings, internships, or personal projects—three fundamental metrics stand out: open rate, click-through rate (CTR), and conversions. These metrics provide insights into audience engagement, content effectiveness, and campaign outcomes. This article explains in detail how students can measure these metrics, the tools and methods involved, the significance of each, and potential challenges. It concludes with a practical example demonstrating their application in a student-led email campaign. The discussion reflects the state of email marketing in 2025, incorporating modern platforms and practices.
Understanding the Metrics
1. Open Rate
Definition: Open rate is the percentage of recipients who open an email out of the total number of emails successfully delivered. It indicates how compelling the subject line, sender name, and preheader text are in enticing recipients to engage.
- Formula: Open Rate(%)=(Number of Emails OpenedNumber of Emails Delivered)×100\text{Open Rate} (\%) = \left( \frac{\text{Number of Emails Opened}}{\text{Number of Emails Delivered}} \right) \times 100
- Example: If 1,000 emails are delivered and 250 are opened, the open rate is: (2501000)×100=25%\left( \frac{250}{1000} \right) \times 100 = 25\%
2. Click-Through Rate (CTR)
Definition: CTR is the percentage of recipients who click on at least one link within an email out of the total number of emails delivered. It measures the effectiveness of the email’s content, design, and calls-to-action (CTAs).
- Formula: CTR(%)=(Number of ClicksNumber of Emails Delivered)×100\text{CTR} (\%) = \left( \frac{\text{Number of Clicks}}{\text{Number of Emails Delivered}} \right) \times 100
- Example: If 1,000 emails are delivered and 50 recipients click a link, the CTR is: (501000)×100=5%\left( \frac{50}{1000} \right) \times 100 = 5\%
3. Conversions
Definition: Conversions represent the percentage of recipients who complete a desired action (e.g., making a purchase, registering for an event, filling out a form) after clicking a link in the email. The conversion rate measures the email’s ability to drive meaningful outcomes.
- Formula: Conversion Rate(%)=(Number of ConversionsNumber of Emails Delivered)×100\text{Conversion Rate} (\%) = \left( \frac{\text{Number of Conversions}}{\text{Number of Emails Delivered}} \right) \times 100 Alternative Formula (based on clicks):(Number of ConversionsNumber of Clicks)×100\text{Alternative Formula (based on clicks)}: \left( \frac{\text{Number of Conversions}}{\text{Number of Clicks}} \right) \times 100
- Example: If 1,000 emails are delivered and 20 recipients complete a purchase, the conversion rate is: (201000)×100=2%\left( \frac{20}{1000} \right) \times 100 = 2\% If 50 clicks lead to 20 conversions, the click-to-conversion rate is: (2050)×100=40%\left( \frac{20}{50} \right) \times 100 = 40\%
How Students Measure These Metrics
Students can measure open rate, CTR, and conversions using email marketing platforms, analytics tools, and manual calculations. Below is a detailed breakdown of the process for each metric.
Measuring Open Rate
- Email Marketing Platform Analytics:
- Most email tools (e.g., Brevo, Mailchimp, Klaviyo, HubSpot) provide built-in dashboards displaying open rates for each campaign.
- Platforms track opens using a tiny, invisible pixel (tracking pixel) embedded in the email. When the email is opened, the pixel loads, registering an open.
- Students access the campaign report (e.g., in Mailchimp’s “Reports” tab) to view the open rate, total opens, and delivered emails.
- Example: In Brevo, students navigate to “Campaigns” > “Reports” to see a 25% open rate for a sent email.
- Manual Verification:
- If raw data is exported (e.g., as a CSV file), students calculate open rate using the formula above.
- Steps:
- Obtain the number of emails delivered (total sent minus bounces).
- Obtain the number of unique opens (platforms distinguish unique opens from multiple opens by the same recipient).
- Apply the formula.
- Challenge: Some recipients disable image loading, underreporting opens. Students should note this limitation.
- Best Practices:
- Test subject lines using A/B testing features in platforms like Klaviyo to optimize open rates.
- Monitor sender reputation to ensure emails reach the inbox, as spam folder emails skew open rates.
- Use preheader text to complement subject lines, increasing open likelihood.
Measuring Click-Through Rate (CTR)
- Email Platform Analytics:
- Email tools track clicks by appending unique tracking parameters to URLs in the email (e.g., ?utm_source=email).
- Campaign reports show CTR, total clicks, and the most-clicked links.
- Example: In HubSpot, students view the “Performance” tab to see a 5% CTR and identify which CTA (e.g., “Shop Now”) performed best.
- Manual Calculation:
- Export campaign data to a spreadsheet.
- Steps:
- Collect the number of unique clicks (platforms track unique clicks per recipient).
- Use the number of emails delivered.
- Apply the CTR formula.
- Note: Some platforms report “click-to-open rate” (clicks divided by opens), which students should distinguish from CTR.
- Best Practices:
- Design clear, compelling CTAs to boost clicks.
- Use responsive email templates to ensure links are clickable on mobile devices.
- Analyze which links perform best to refine content placement (e.g., buttons vs. text links).
Measuring Conversions
- Defining Conversions:
- Students must first define the desired action (e.g., purchase, form submission, event registration).
- This action typically occurs on a website after a recipient clicks an email link.
- Tracking Conversions:
- Email Platform Tracking:
- Many platforms (e.g., Klaviyo, ActiveCampaign) integrate with websites to track conversions using UTM parameters or JavaScript snippets.
- Students set up “goals” or “events” in the platform (e.g., “Purchase Completed” in Brevo) linked to website actions.
- Conversion data appears in campaign reports, showing the number of conversions and conversion rate.
- Website Analytics Integration:
- Tools like Google Analytics 4 (GA4) track conversions when users arrive via email links with UTM parameters (e.g., utm_medium=email).
- Students create goals in GA4 (e.g., “Form Submission”) and attribute conversions to email campaigns.
- Ecommerce Platforms:
- For ecommerce, platforms like Shopify integrate with email tools (e.g., Omnisend) to track purchases directly, reporting revenue and conversion rates.
- Example: In Klaviyo, students set up a “Placed Order” event for Shopify purchases, seeing a 2% conversion rate in the campaign report.
- Email Platform Tracking:
- Manual Tracking:
- If platforms lack direct tracking, students use unique landing pages or promo codes in emails to track conversions.
- Steps:
- Create a dedicated landing page (e.g., website.com/email-offer) for email recipients.
- Track completions (e.g., form submissions, purchases) via website analytics or CRM.
- Calculate conversion rate using the formula.
- Challenge: Manual tracking is prone to errors if multiple traffic sources use the same landing page.
- Best Practices:
- Use clear, trackable CTAs leading to conversion-focused landing pages.
- Integrate email and website analytics for accurate attribution.
- Test email content (e.g., discounts vs. free resources) to optimize conversion rates.
Significance and Challenges
Significance
- Open Rate: Reflects initial engagement and subject line effectiveness. A low open rate suggests poor sender reputation, weak subject lines, or unengaged audiences.
- CTR: Indicates content relevance and CTA strength. A high CTR suggests compelling design and messaging.
- Conversions: Measures campaign ROI and goal achievement. High conversion rates validate the entire email strategy.
Challenges
- Data Accuracy: Open rates may be underreported due to image-blocking or privacy features (e.g., Apple’s Mail Privacy Protection).
- Attribution: Multi-channel campaigns (e.g., email + social media) complicate conversion attribution.
- List Quality: Poorly maintained lists (e.g., inactive subscribers) lower all metrics.
- Technical Barriers: Students may struggle with setting up tracking codes or integrations without technical support.
- Interpretation: Metrics must be contextualized (e.g., a 20% open rate is average for retail but low for nonprofits).
Tools and Platforms in 2025
Students can use the following platforms to measure these metrics:
- Email Tools: Brevo, Mailchimp, Klaviyo, HubSpot, Omnisend, ActiveCampaign, MailerLite.
- Analytics Tools: Google Analytics 4, Shopify Analytics, WordPress plugins (e.g., MonsterInsights).
- Integration Platforms: Zapier, Make, to connect email tools with websites or CRMs.
- List Hygiene Tools: NeverBounce, ZeroBounce to ensure accurate data.
Example: Student-Led Email Campaign for a University Event
Scenario: A group of marketing students at a university uses Mailchimp to promote a sustainability conference. They have a list of 1,500 opted-in students and alumni and aim to drive registrations (conversions).
Implementation:
- Campaign Setup:
- Students create an email campaign in Mailchimp with the subject line “Join Our Sustainability Conference!” and a preheader: “Learn from eco-experts.”
- The email includes a CTA button (“Register Now”) linking to a unique landing page (university.com/conference-email) with a registration form.
- They embed Mailchimp’s tracking pixel and UTM parameters (utm_source=mailchimp&utm_medium=email) for analytics.
- Measuring Open Rate:
- After sending, Mailchimp’s “Reports” tab shows 1,450 emails delivered (50 bounced) and 435 opened.
- Calculation: (4351450)×100=30%\left( \frac{435}{1450} \right) \times 100 = 30\%
- Insight: The 30% open rate is above the education industry average (20–25%), indicating a strong subject line.
- Measuring Click-Through Rate:
- Mailchimp reports 87 unique clicks on the “Register Now” button.
- Calculation: (871450)×100=6%\left( \frac{87}{1450} \right) \times 100 = 6\%
- Insight: The 6% CTR suggests effective email design, but students note the CTA button’s placement (below the fold) may limit clicks.
- Measuring Conversions:
- Students integrate Mailchimp with Google Analytics 4, setting a “Form Submission” goal for the landing page.
- GA4 reports 29 registrations from email traffic (tracked via UTM parameters).
- Conversion rate: (291450)×100=2%\left( \frac{29}{1450} \right) \times 100 = 2\%
- Click-to-conversion rate: (2987)×100≈33.3%\left( \frac{29}{87} \right) \times 100 \approx 33.3\%
- Insight: The 2% conversion rate is solid for a free event, but the 33.3% click-to-conversion rate suggests the landing page is effective once users arrive.
- Optimization:
- Students run an A/B test with a new subject line (“Save Your Spot at the Sustainability Summit!”), achieving a 32% open rate.
- They move the CTA button above the fold, increasing CTR to 7.5%.
- They simplify the landing page form, boosting conversions to 35 registrations (2.4% conversion rate).
- Results: The optimized campaign drives 100 total registrations, exceeding the goal of 80.
Key Takeaways:
- Mailchimp’s analytics simplified metric tracking for students.
- A/B testing and design tweaks improved all metrics.
- Integration with GA4 ensured accurate conversion attribution.
Conclusion
Measuring open rate, click-through rate, and conversions is a foundational skill for students learning email marketing in 2025. Open rate reflects initial engagement, CTR gauges content effectiveness, and conversions measure campaign success. Students can leverage email platforms like Mailchimp, Brevo, and Klaviyo, alongside analytics tools like Google Analytics, to track these metrics accurately. Challenges like data accuracy and attribution require careful consideration, but best practices—such as A/B testing, clear CTAs, and list hygiene—enhance results. The university conference example illustrates how students can apply these metrics to real-world campaigns, optimizing performance and achieving goals. By mastering these measurements, students equip themselves to create impactful, data-driven email marketing strategies in a competitive digital landscape.